Today is the 100 year anniversary of the sinking of the Titanic – an incredibly horrific tragedy that resulted in the deaths of 1,514 individuals. That accounted for over 2/3 of the individuals onboard. This from the ship that was dubbed “unsinkable” and was so confident in its invincibility that its lifeboat capacity could accomodate for less than half of the individuals on the ship (they decided that they didn’t want the “extra lifeboats” to ruin the aesthetic beauty of the ship’s decks). While this means that most of the individuals didn’t make it, it does not mean that everyone on the ship had an equal chance at surviving. In fact, it was quite the opposite.
This can be used as a starting point for those trying to introduce the concept of social stratification (a suggestion from the Newman textbook I have used in intro classes). The Titanic represents a very clear-cut example of social class divisions providing different opportunities (in this case, opportunities to get on a lifeboat and survive) to individuals occupying different classes. Your odds of survival were greatly shaped by your structural location aboard the ship (i.e. your social class, gender, and age).
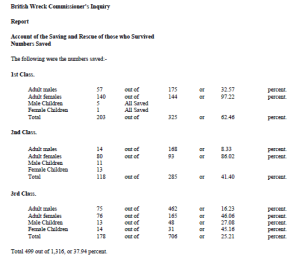
Here is an interesting chart illustrating the survivor rates by gender and class:
That chart is the official report from the British Board of Trade on the survivors (a clearer view of the chart there). Clearly, members of some social classes were more likely to survive than others…
While I haven’t used this specific example in class, I’m sure that it could be effectively used to illustrate structural location and access to resources (in this case a life or death situation). I would imagine that one potential challenge you may encounter is the “that was back then, social class doesn’t work that way now,” line. While it’s true that social class probably isn’t quite as rigid now as it was in the days of Titanic, a few more modern examples could be used in conjunction. In any case, this is a good way (through a great illustrative chart) to at least get students thinking about and on their way to understanding consequences of social class and stratification systems.
 It’s also a good way to remind the kids that the Titanic was real and not just a movie. Apparently there are people who think that it’s just another sappy, love-story film (see the comments at the end – yikes!).
The movie portrayals of social class and how things were done at the time could also be fruitfully used and analyzed as well, but you may get a segment of individuals claiming that “it’s just a movie” or “that things are exaggerated to make a good story” (both true to an extent). That is an additional reason why I think that the real data is so powerful along with being so clear-cut.


アバクロ パンツ
September 11, 2013 at 10:05 PM
アバクロンビー&フィッチ
LikeLike
E
November 17, 2013 at 7:49 AM
The chart is incorrect. Miss Helen Loraine Allison was 2 years old when she boarded the Titanic with her father, mother and brother. After the collision, her family was separated, and her 11month old brother survived, as he was taken into a lifeboat by the child’s nurse Alice Cleaver but the herself and her family perished. She was the only child in either 1st or 2nd class to die
LikeLike